Join our newsletter


In today’s competitive landscape, industrial and manufacturing businesses lose millions each year to unplanned downtime, inefficiency, and missed optimization opportunities.
Deloitte reports that 82% of leaders admit they don’t fully leverage real-time data for decision-making.
The cost? Missed revenue, higher maintenance spend, and shrinking margins.
It doesn’t have to be this way.
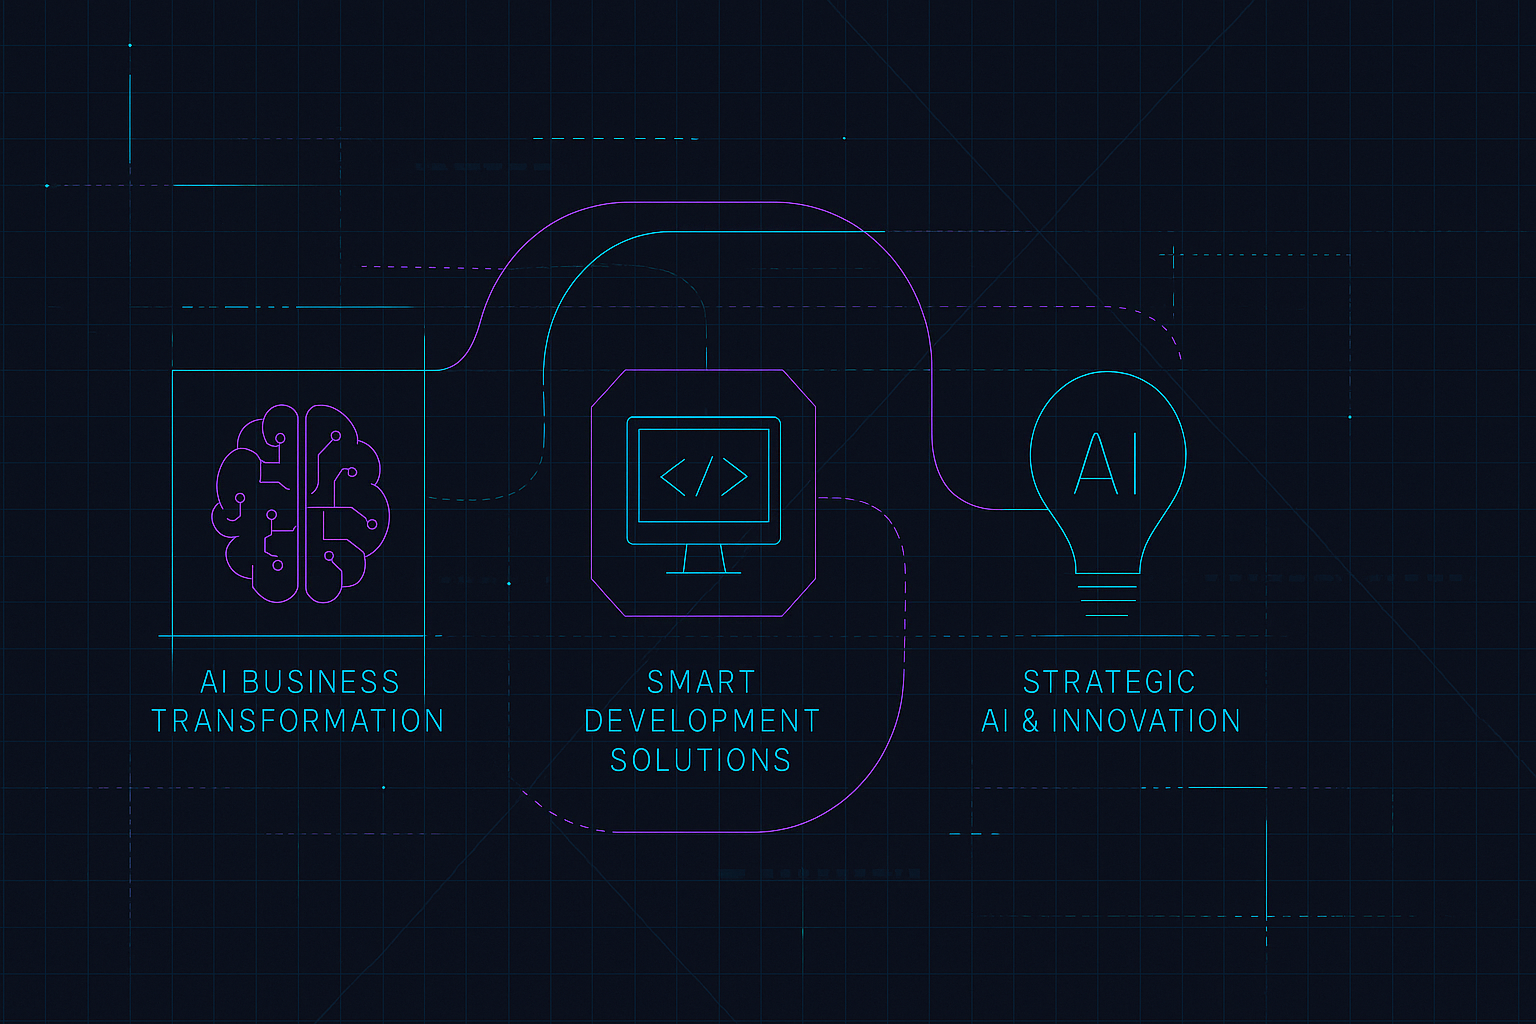
We help organizations unlock the full value of their operations through an AI-first transformation.
Integrate, analyze, and automate so every decision is faster, smarter, and grounded in real-time insights.
Through our AI Business Transformation and Smart Development Solutions, we deliver:
Want to explore your AI readiness? Let’s start with an AI Strategy Roadmap tailored to your business.
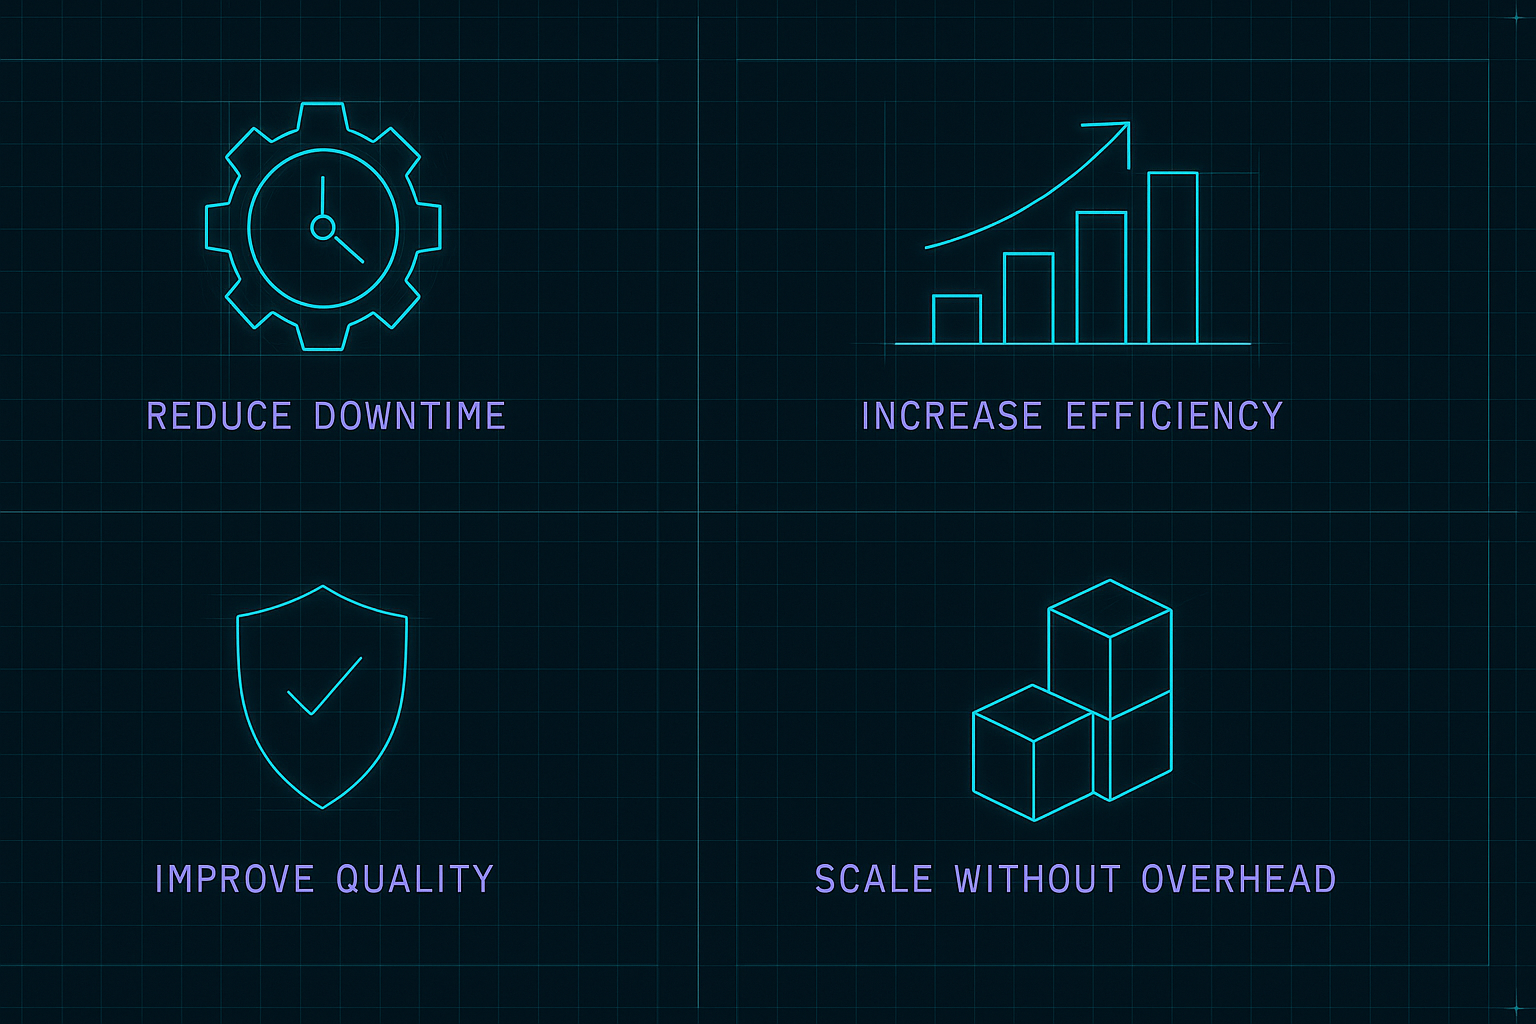
Reduce Downtime Before It Happens
Machine learning models can flag anomalies early, preventing costly breakdowns.
Increase Operational Efficiency
Real-time dashboards reveal bottlenecks instantly, enabling fast intervention.
Improve Quality Outcomes
Automated inspection powered by AI reduces defect rates without slowing production.
Scale Without Overhead
Automation and smart APIs allow expansion without proportional increases in staff or cost.
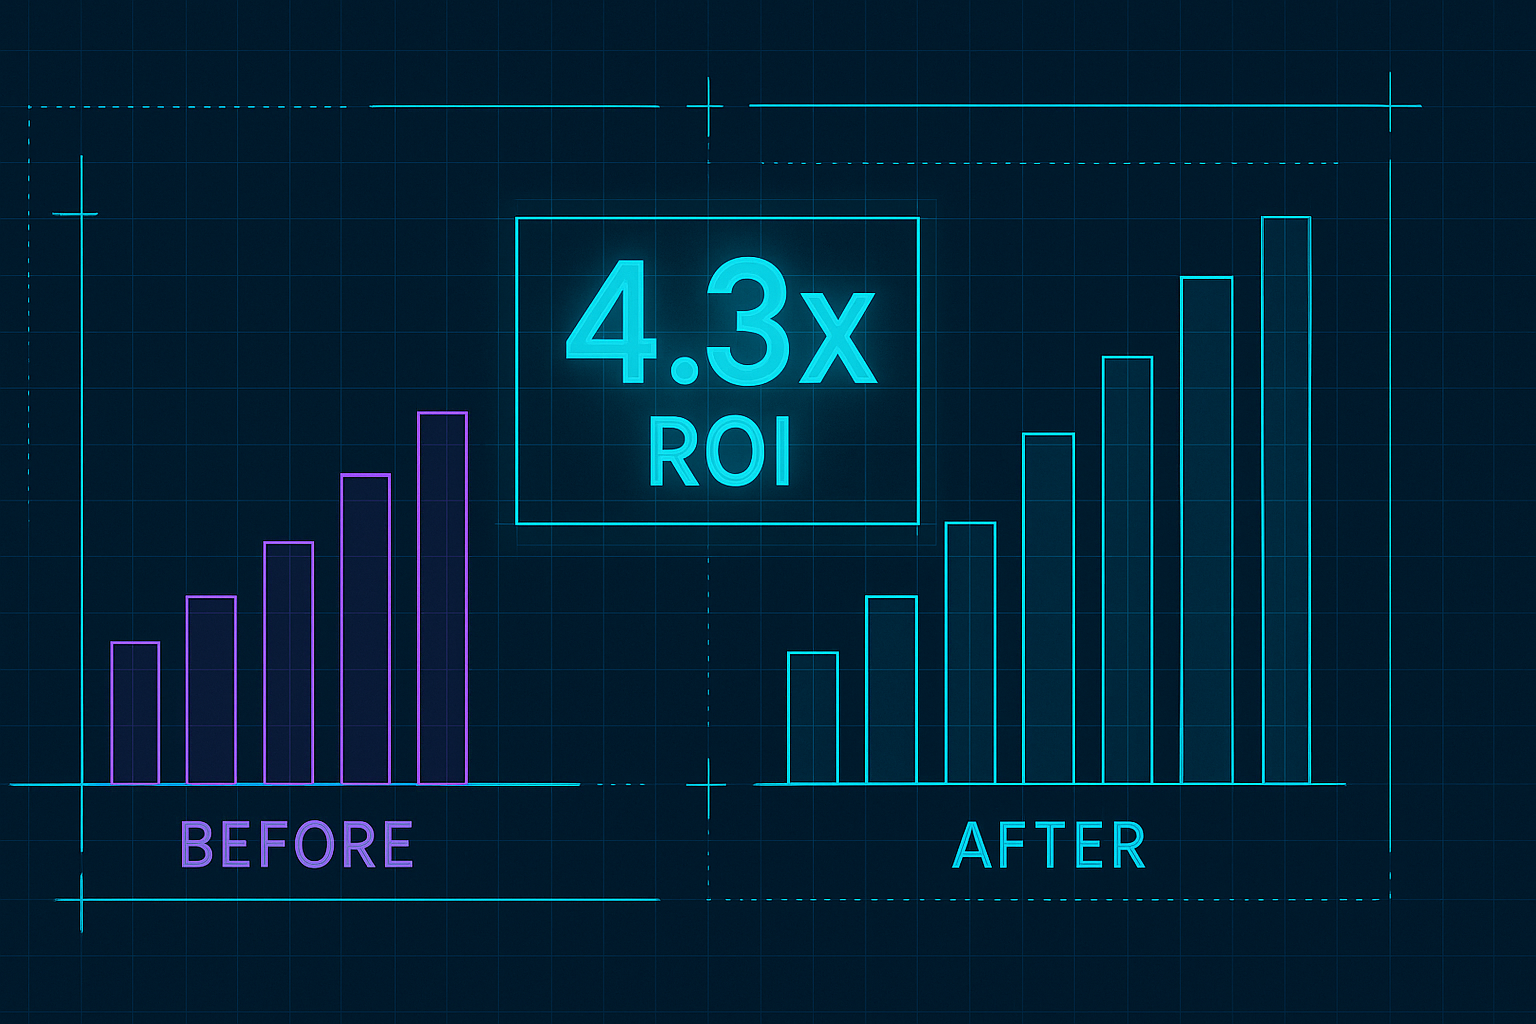
A mid-sized manufacturer partnered with us to integrate AI-powered analytics and anomaly detection into its existing systems.
In the first 90 days, they achieved:
| Metric | Before | After | Impact |
|---|---|---|---|
| Unplanned Downtime | 14 hrs/month | 6 hrs/month | -57% |
| Maintenance Costs | $42K/month | $29K/month | -31% |
| Energy Consumption | 1.2M kWh | 1.0M kWh | -16% |
| Throughput Efficiency | 82% | 91% | +9 pts |
ROI in first quarter: 4.3x

Before we build, we quantify potential impact.
Our ROI approach covers savings, revenue gains, and quality improvements:
Formula:
ROI (%) = (Net Benefits / Total Investment) × 100
Example:
Labor savings: 0.4 × $50K = $20K
Increased production value: 8% of $200K = $16K
Quality improvement: $4K
Net Benefits = $40K – ongoing costs
If investment = $100K → ROI = 40%
Run an ROI session with us — see your payback period before you invest.
Here’s a simplified Python example for detecting anomalies in sensor or operational data.
python
CopyEdit
import pandas as pd
from sklearn.ensemble import IsolationForest
from sklearn.preprocessing import StandardScaler

# Load & preprocess
df = pd.read_csv('sensor_data.csv').dropna()
scaled = StandardScaler().fit_transform(df)

# Train anomaly detection model
model = IsolationForest(n_estimators=100, contamination=0.05, random_state=42)
model.fit(scaled)

# Predict anomalies
df['anomaly'] = model.predict(scaled)
anomalies = df[df['anomaly'] == -1]
print(f"Anomalies detected: {len(anomalies)}")
This approach helps surface unusual patterns early, which can be tied into automated alerts, maintenance workflows, or quality control systems.
♟ Low risk, high reward — start small, validate fast, and scale with confidence.

Let’s turn your data into a competitive advantage:
👉 Let’s talk and make your operations future-proof, intelligent, and profitable. Send an email to sales@kenility.com